
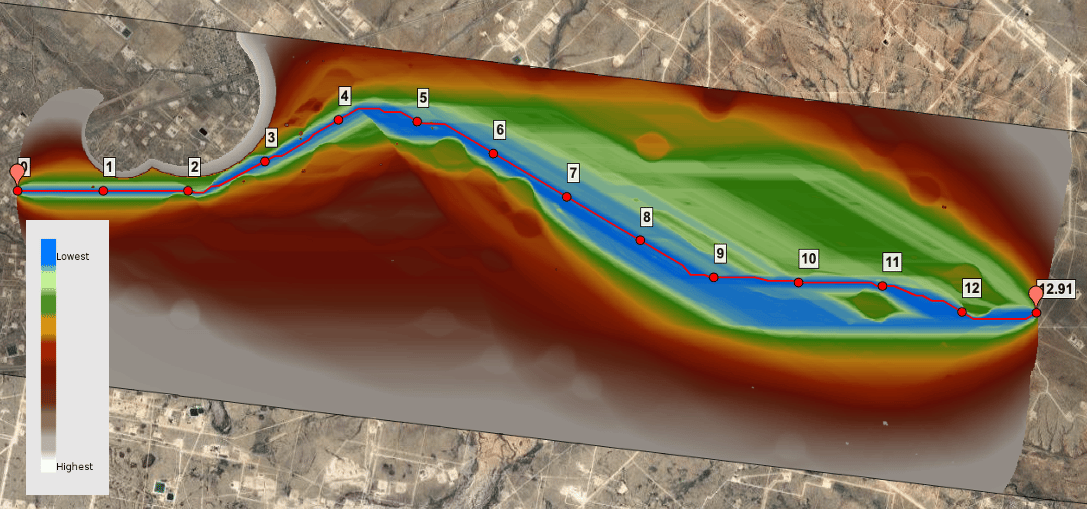
If you’ve routed a pipeline or walked one through permitting, you already know the hard part was never drawing the line. It’s everything underneath it: the ownership that changed hands last quarter, the wetland determination that shifted with the latest rule, the rail crossing agreement that quietly adds four months to the schedule. The centerline is the easy part. The data is the project.
Most of what follows won’t be new to a seasoned routing or permitting lead. The goal is to give practitioners an honest view on where routing and permitting data actually breaks, and what it takes to keep a route defensible when someone challenges it. Here are eight things worth saying out loud.
-
The vintage of a dataset matters more than its resolution. A crisp, high-resolution polygon isn’t the same as a current one. National Wetlands Inventory data can predate your project by decades. Parcel and ownership layers churn constantly. Habitat designations change with listings and delistings. The question that actually governs defensibility is “when was it last true?” A permitting decision built on a confident-looking but stale layer is exactly the kind that unravels under review.
-
“Least-cost” is a total-risk number, not a cost-per-mile number. The shortest, flattest alignment is rarely the cheapest to build or the fastest to permit. Crossing counts, horizontal directional drilling, holdout landowners, and agency review time routinely dominate the real cost of a route, and none of them show up in a distance-times-terrain calculation. A routing analysis that weights only length and slope optimizes for the wrong number. The alignments that survive are the ones scored against constraint cost: land use, environmental sensitivity, proximity to existing corridors, and the permitting exposure each foot of centerline creates.
-
Your permit matrix is a function of every foot of centerline, and it changes with every tweak. A single reroute can touch multiple counties, tribal lands, federal surface managed by BLM or USFS, more than one USACE district, and a stack of state agencies, each with its own clock and, frustratingly, its own working definition of the same feature. Move the line 200 feet to dodge a slope and the required-permit list can change underneath you. This is why permitting can’t live in a static spreadsheet that’s built once and trusted for the life of the project. The matrix is downstream of the alignment, and the alignment always moves.
-
Regulatory constraint layers move — sometimes mid-project. This is the one that quietly resets projects. The jurisdictional definition of Waters of the U.S. narrowed with Sackett in 2023, narrowed further in a proposed rule in late 2025, and is still moving through rulemaking and litigation into 2026. Species constraints are just as volatile: the dunes sagebrush lizard was listed as endangered in 2024, then had that listing vacated by a court settlement in mid-2026 (now under appeal), while the lesser prairie-chicken listing was struck down earlier in the same year. Whatever your view of any of it, the operational reality is the same: a constraint that was binding when you started screening may not be binding at filing, or vice versa. Over-permit and you’ve burned budget and schedule; under-permit and you’ve got a violation. Screening data has to track the current line, not a snapshot from the day the project kicked off.
-
The constraints that hurt the most aren’t clean polygons. Endangered species habitat, migratory timing windows, cultural and archaeological sensitivity, and tribal consultation areas rarely arrive as tidy shapes you can simply avoid. They’re buffered, seasonal, confidential, or all three. And for many of them the binding constraint is a date, not a boundary: a construction blackout window can move a schedule as hard as a re-route. Experienced teams plan around the calendar as much as the geometry, because a route that’s spatially clean can still be seasonally locked.
-
Landowner and parcel data ages fastest and hurts most. Right-of-way cost and schedule ride almost entirely on ownership accuracy, and ownership is the layer most likely to be wrong. Parcels split and sell. LLCs, absentee owners, and heirs’ property obscure who actually signs. A route that looks clean on the screen can stall for months on a single title problem the data never surfaced, and no amount of routing sophistication upstream fixes a bad contact downstream. Parcel accuracy and clean landowner outreach lists aren’t administrative afterthoughts; they’re on the critical path.
-
A route is a hypothesis until the crossings are quantified. The number and type of crossings decide the project. Perennial versus intermittent streams, paved versus unpaved roads, rail, and foreign pipelines or utilities each drive construction methodology (bore versus open-cut), the agreements you’ll need (railroad crossing agreements are famously slow), and the cost. Until those crossings are counted and classified, a route is a line with a story attached, not a plan. Crossing and impact reporting is what turns the alignment into an actual construction and permitting sequence with numbers behind it.
-
Defensibility is a data-lineage problem.
When a route gets challenged by a landowner, an intervenor, or a regulator you have to show your work: which datasets, which versions, and which constraints were weighted how. Whether you’re filing a FERC certificate application for interstate gas or making a state routing case for a liquids line, reproducible, sourced analysis holds up and “we ran it and this is what came out” does not. The lasting value of screening data isn’t just the answer it gives you today; it’s also the audit trail it leaves for the day someone asks how you got there.
Where this leaves most teams
None of this is a revelation to someone experienced in routing pipeline and energy projects. The problem is that the tooling most teams still use treats these eight things as eight separate scavenger hunts across eight sources, which is how a stale layer or an uncounted crossing slips through in the first place.
Pivvot Route pulls land ownership, environmental, geotechnical, and infrastructure data into a single screen and runs least-cost routing against it, then generates the crossing, impact, and permit-matrix outputs the rest of the project depends on — in hours, not weeks.
Have an alignment in play? The fastest way to see the difference is to run one. Put a real corridor through Pivvot Route and compare the crossing count, the permit matrix, and the time it took against your last project.