

At Pivvot, we’re constantly looking for new data to add to our platform and help our customers make more informed decisions. When customers ask for data such as Hail History in an area being considered for a solar farm, or LiDAR to get more accurate slope calculations for any infrastructure – we listen.
Below, you’ll find weather data included in our library. We describe what the data is and why we feel it’s an important addition based on the use cases our customers have shared.
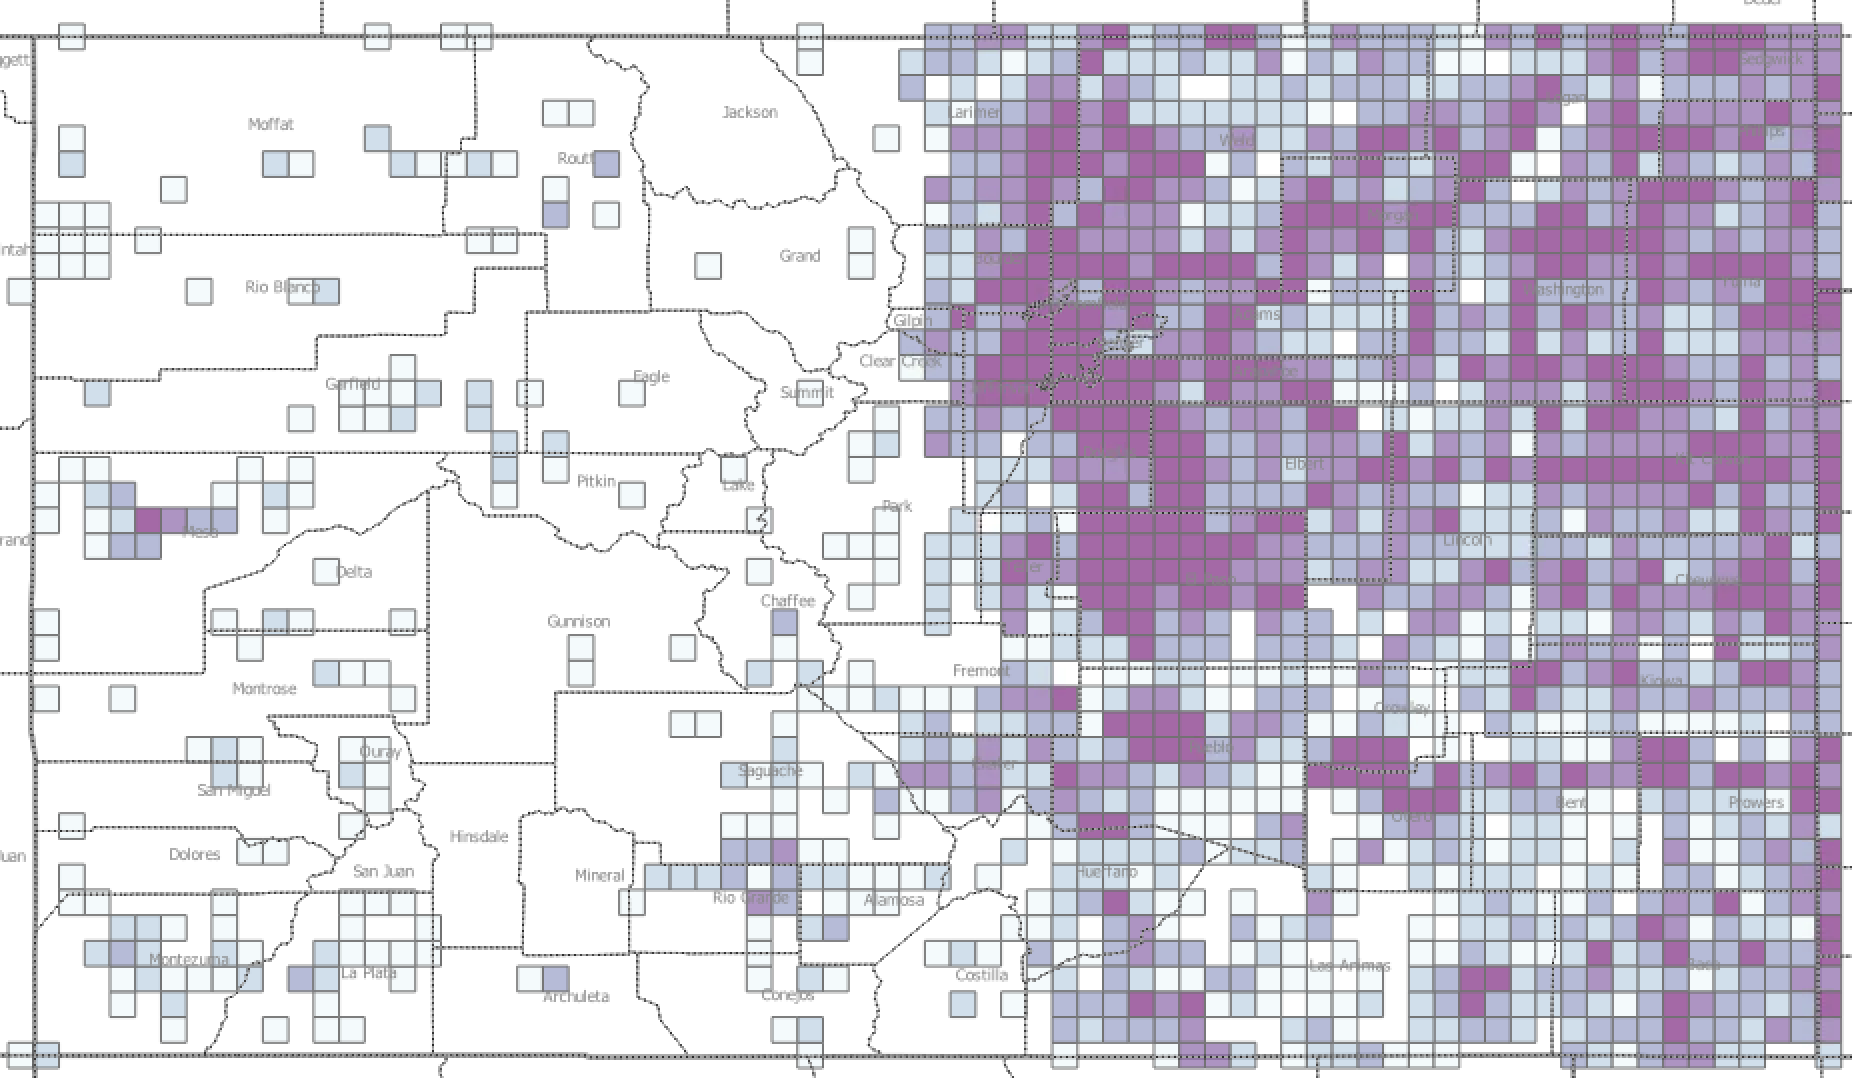
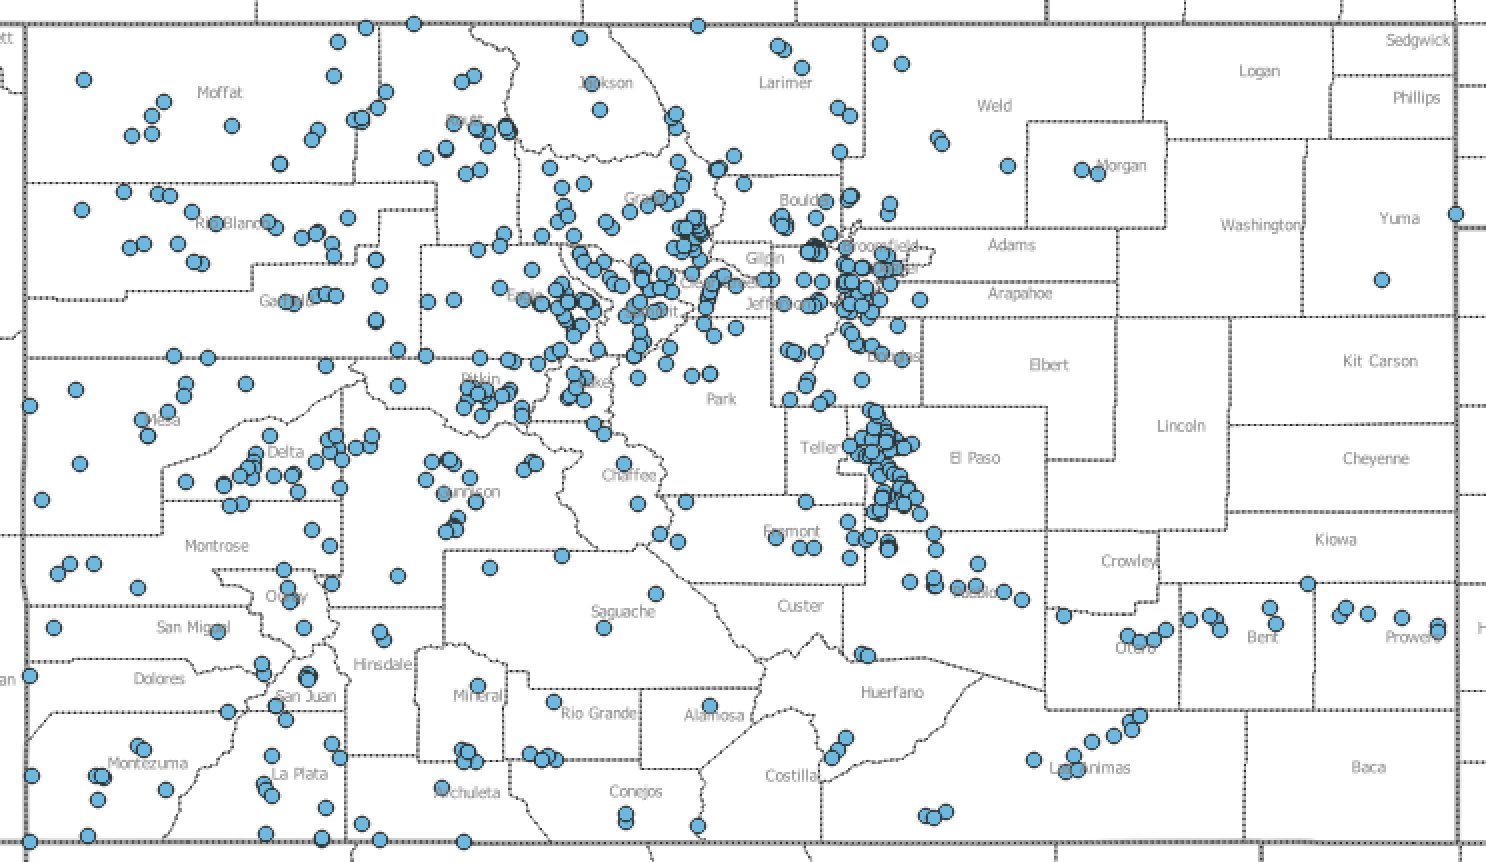
Hail Events
Hail events data shows the occurrence, density and severity of historical hail events. This layer was derived by intersection hail paths recorded by the North American Oceanic and Atmospheric Agency (NOAA) since 1955 with the Pivvot Micro DEM Grid. The Micro DEM grid represents 0.1 degree by 0.1 degree cells with the origin of the lower cell in a 9x9 array based on the lower corner of the 1 degree by 1 degree grids used to delineate the United States Geologic Survey (USGS) Digital Elevation Model (DEM) tiles.
The layer is a representation of varying amounts of historic data and is intended to provide an indication of historic hail events. The symbolization is based on a quintiles distribution of total hail events over the entire collection period and are divided into groups as shown in the legend above. The data are updated yearly and Important attributes from this layer include:
Historic hail size diameter
- Injury count
- Fatalities count
- Estimated damage cost
- Crop loss in millions of USD
- Total hail events in each grid cell
Why is Hail data important?
Hail data is important for solar siting risk assessments. Areas with high hail activity and large-sized hail history increase the likelihood of damage potential for solar arrays. Understanding the potential for hail damage can also influence damage recovery insurance premiums.
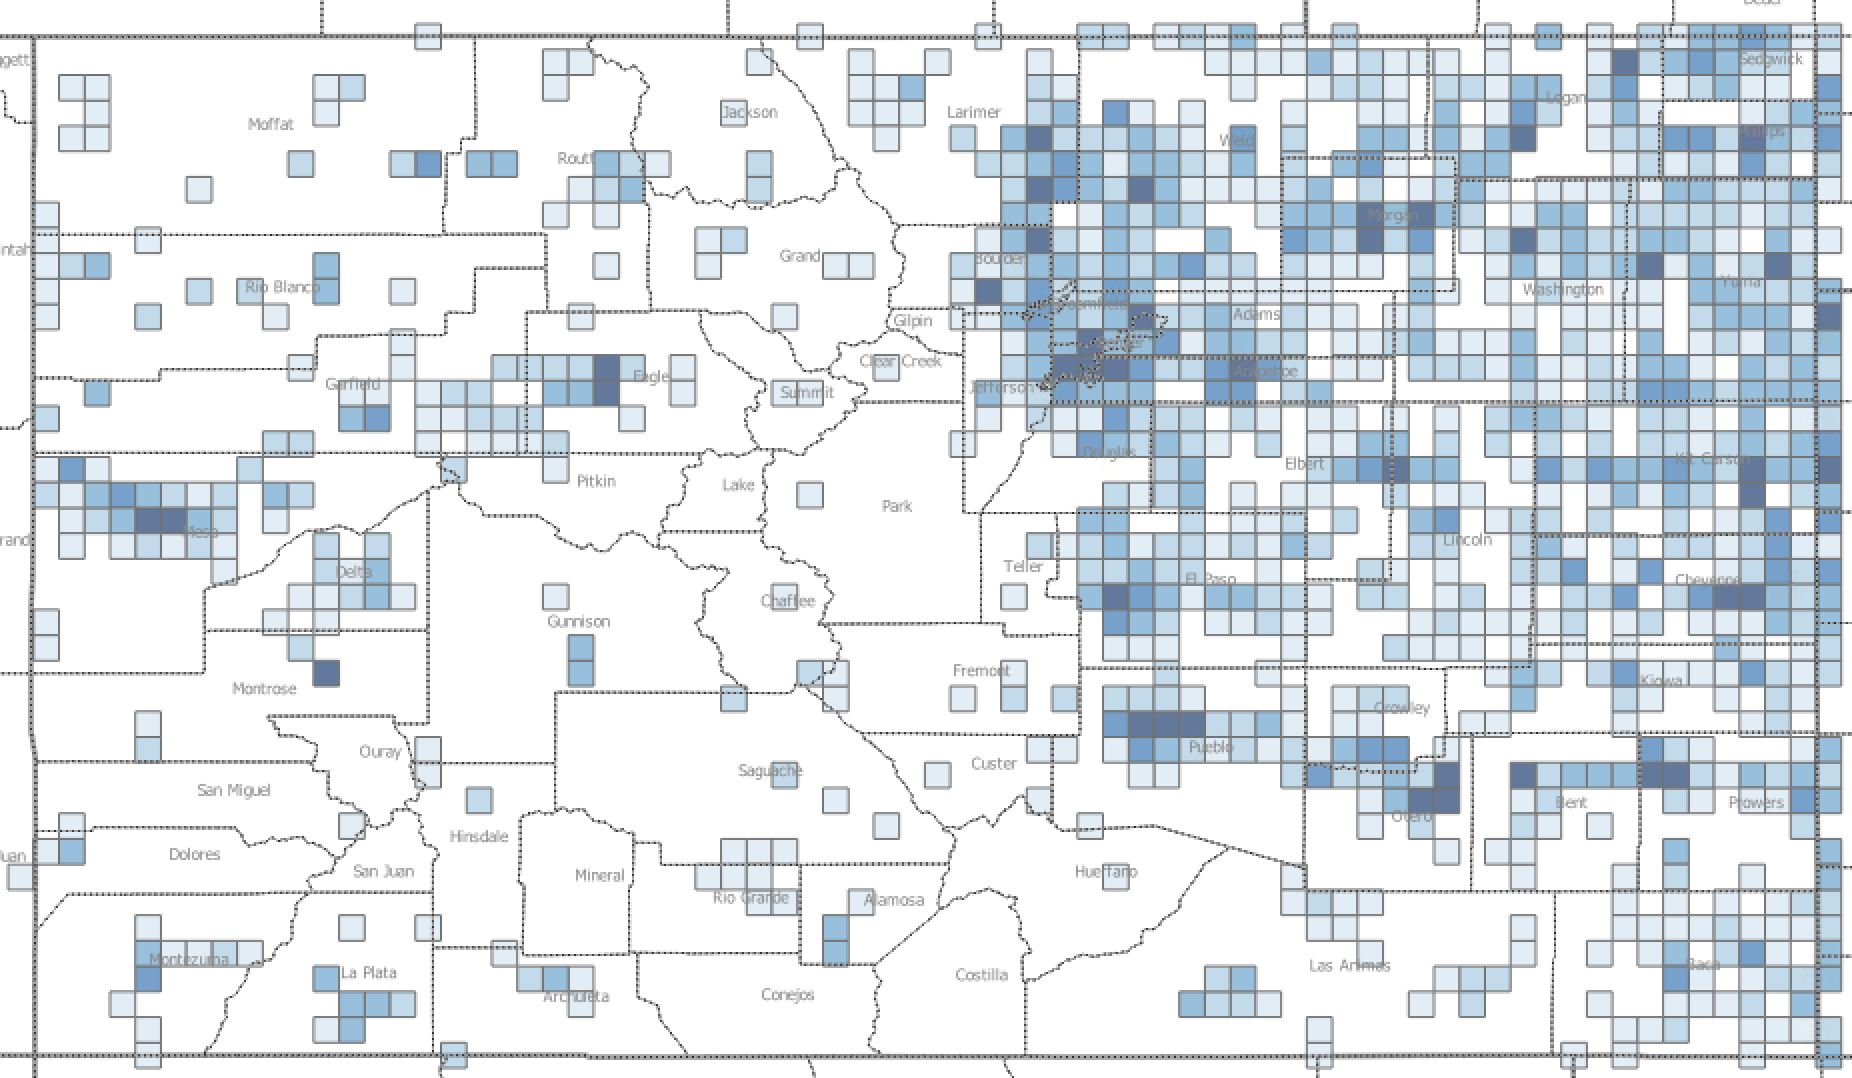
Wind Events
The Wind Events layer shows the occurrence, density and severity of historical wind events. This layer was derived by intersection wind paths recorded by the North American Oceanic and Atmospheric Agency (NOAA) since 1955 with the Pivvot Micro DEM Grid. The Micro DEM grid represents 0.1 degree by 0.1 degree cells with the origin of the lower cell in a 9x9 array based on the lower corner of the 1 degree by 1 degree grids used to delineate the United States Geologic Survey (USGS) Digital Elevation Model (DEM) tiles.
The layer is a representation of varying amounts of historic data and is intended to provide an indication of historic wind events. The symbolization is based on a quintiles distribution of total wind events over the entire collection period and are divided into groups as shown in the legend above. The data are updated yearly and Important attributes from this layer include:
- Historic wind speed
- Injury count
- Fatalities count
- Estimated damage cost
- Crop loss in millions of USD
- Total wind events in each grid cell
Why is Wind Event data important?
Wind event data informs solar and wind siting risk. It displays areas of high wind activity as high wind events that could have significant damage potential for solar arrays. Understanding the potential for wind damage can also influence damage recovery insurance premiums for solar farms. Conversely, areas of high wind events may be desirable for the siting and placement of wind turbines.
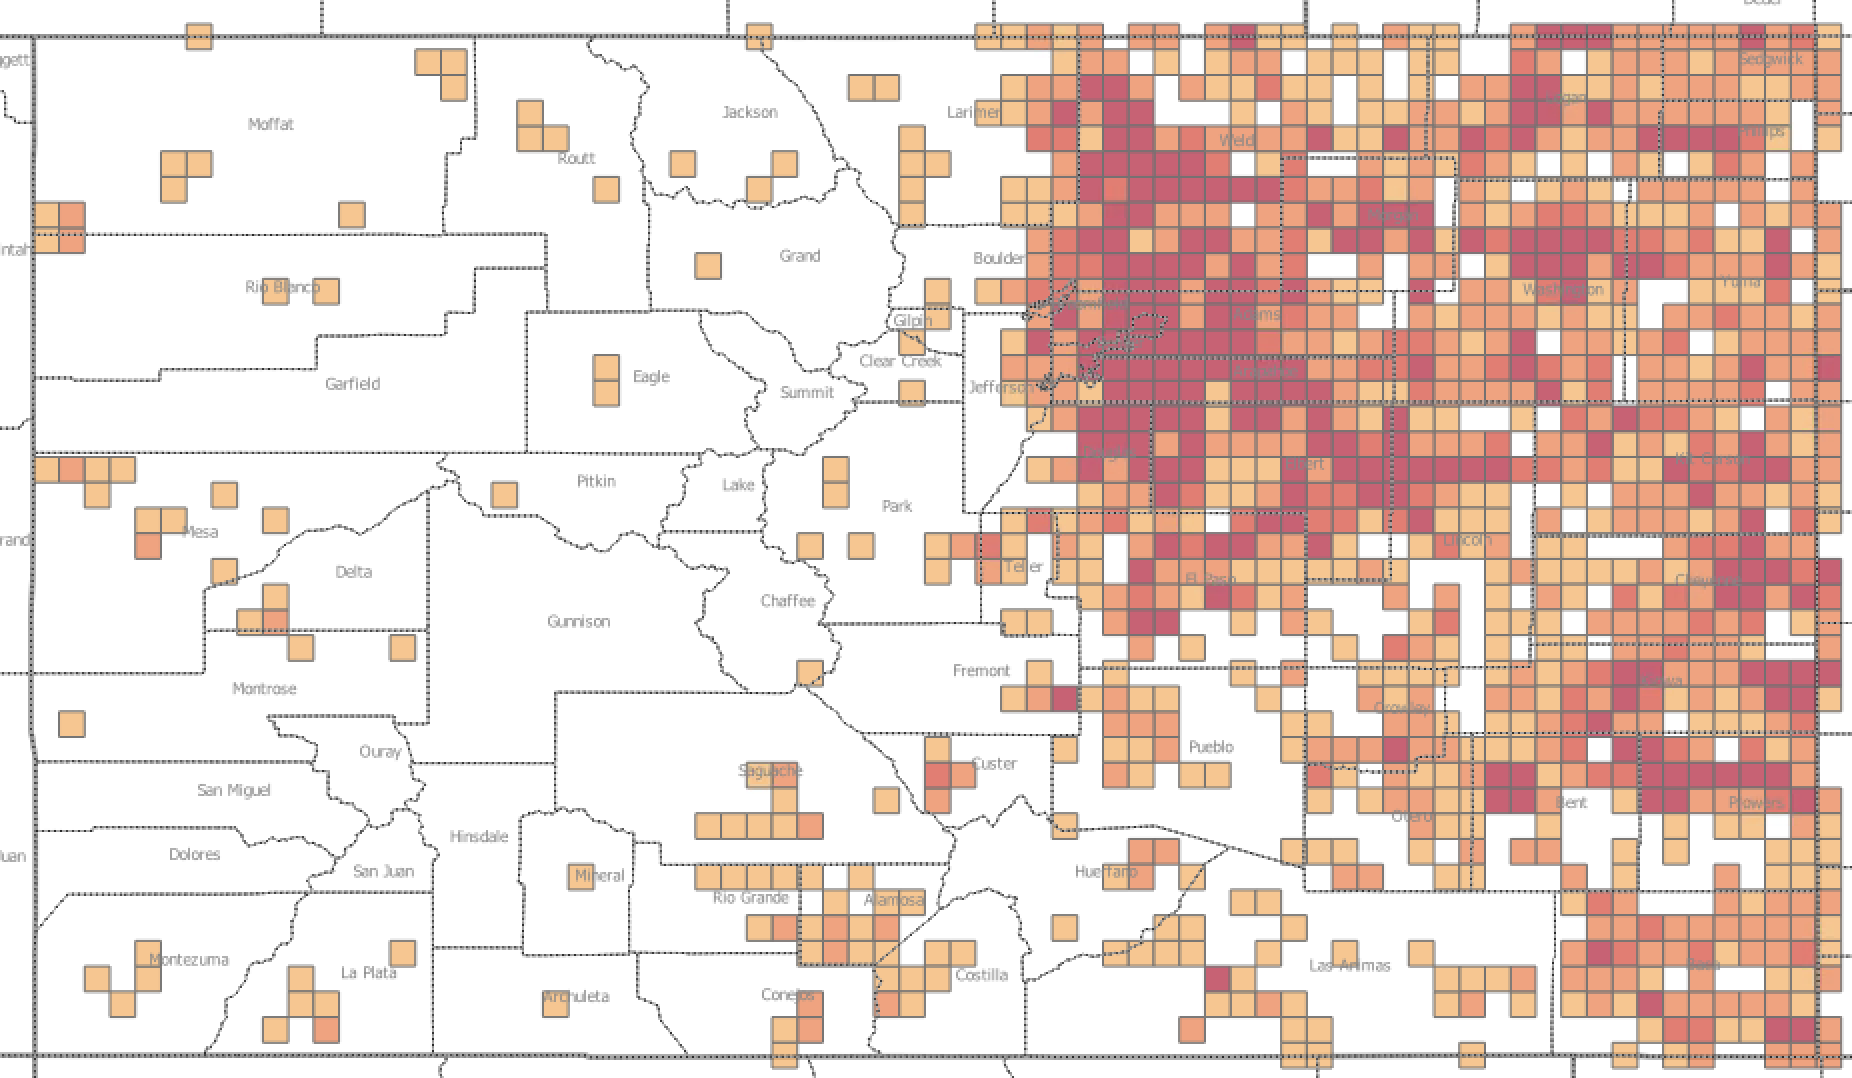
Tornado Events
The Tornado events layer shows the occurrence, density and severity of historical tornado events. This layer was derived by intersection tornado paths recorded by the North American Oceanic and Atmospheric Agency (NOAA) since 1950with the Pivvot Micro DEM Grid. The Micro DEM grid represents 0.1 degree by 0.1 degree cells with the origin of the lower cell in a 9x9 array based on the lower corner of the 1 degree by 1 degree grids used to delineate the United States Geologic Survey (USGS) Digital Elevation Model (DEM) tiles.
The layer is a representation of varying amounts of historic data and is intended to provide an indication of historic tornado events. The data represents 2 forms of tornado classification methods. The Fujita (F) Scale which was used to until early 2007, and the Enhanced Fujita (EF) Scale for everything after. The symbolization is based on a quintiles distribution of total tornado events over the entire collection period and are divided into groups as shown in the legend above. The data are updated yearly and Important attributes from this layer include:
Tornado widths (yds), length (miles), magnitude
- Injury count
- Fatalities count
- Estimated damage cost
- Crop loss in millions of USD
- Total tornado counts in each grid cell since data collection started
Why is Tornado Event data important?
Tornado event data can inform solar and wind farm siting risk. It shows areas of high tornado activity as tornado events could have significant damage potential for solar arrays and wind turbines. Understanding the potential for tornado damage can also influence damage recovery insurance premiums for renewable energy farms.
Municipality
Municipality data is a polygon dataset representing incorporated areas. The origin of this dataset is from the CENSUS Bureau and is derived from the TIGER populated places layer that is used in the Route application. Only records having the value G4110 (flagged as an incorporated place) in the MTFCC column are included in this layer.
Why is Municipality data important?
Municipality data can inform a number of business decisions including permitting.
Stream Gauge
Stream gauge data contains USGS Maintained Stream Gauges for tracking water height and water flow rates. This is a unique layer in the Pivvot data set in that the stream height and speed values are updated each hour and the yearly, monthly averages are calculated each month automatically.
Important attributes for this layer include:
- Site ID and Name – USGS Assigned Site ID and name
- HUC – the watershed the gauge belongs to
- Discharge – discharge in cubic feet at time of reading (streamed data)
- Gauge Height – Height of water level in feet at time of reading (streamed data)
- Past Year Max, Average, Min Discharge
- 1 Year Average, 5 Year Average, 10 Year Average Discharge
- Years included
- Flow all-time High, Flow all-time Low
- Website URL – linking directly to the page containing the latest measurements from the gauge and historical data, graphs and charts
Why is Stream Gauge data important?
Stream gauge data supports operations integrity management and risk assessment. Users can = understand the risk of hydro-flow of oil and/or highly volatile liquids (HVL) in the event of a rupture, leak, or spill. Understanding the location of these features and the rate of flow allows for modeling of potential consequence of these events.
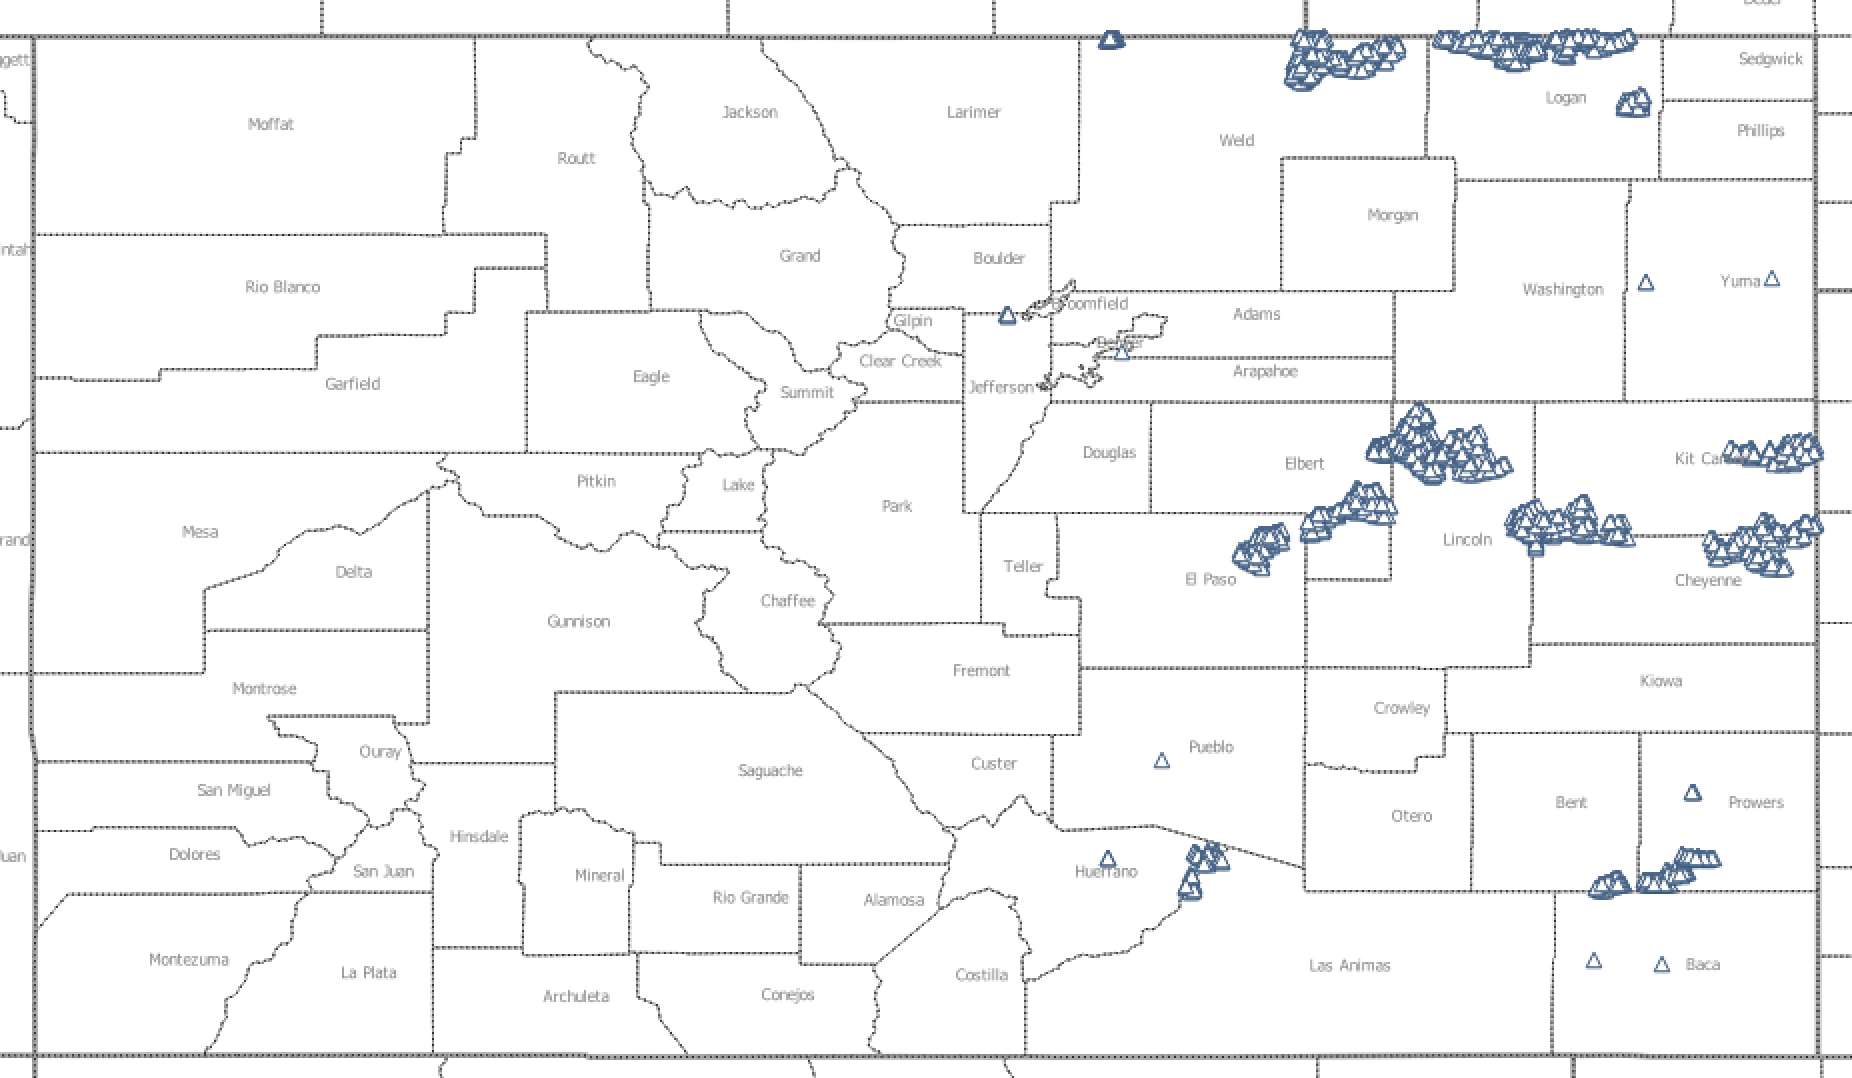
Wind Turbine
Wind turbine data contains US Wind Turbine Database locations of large scale, above ground (and water) wind turbines installed for the purpose of adding electrical power to the existing electrical grid. Important attributes for this layer include:
- FAA Digital Obstacle ID – Federal Aviation Administration flight obstacle assigned ID
- Project capacity in MW – Project capacity in megawatts
- Project Name and data
- Turbine manufacturer, height, model, rotor diameter
Why is Wind Turbine data important?
Wind turbine data show areas that have already been developed for wind power. Conversely, showing wind turbines also reveals areas that currently have not been developed for wind power. As renewable development continues to expand across the U.S., clients are looking for viable sites to add turbines or solar farms.
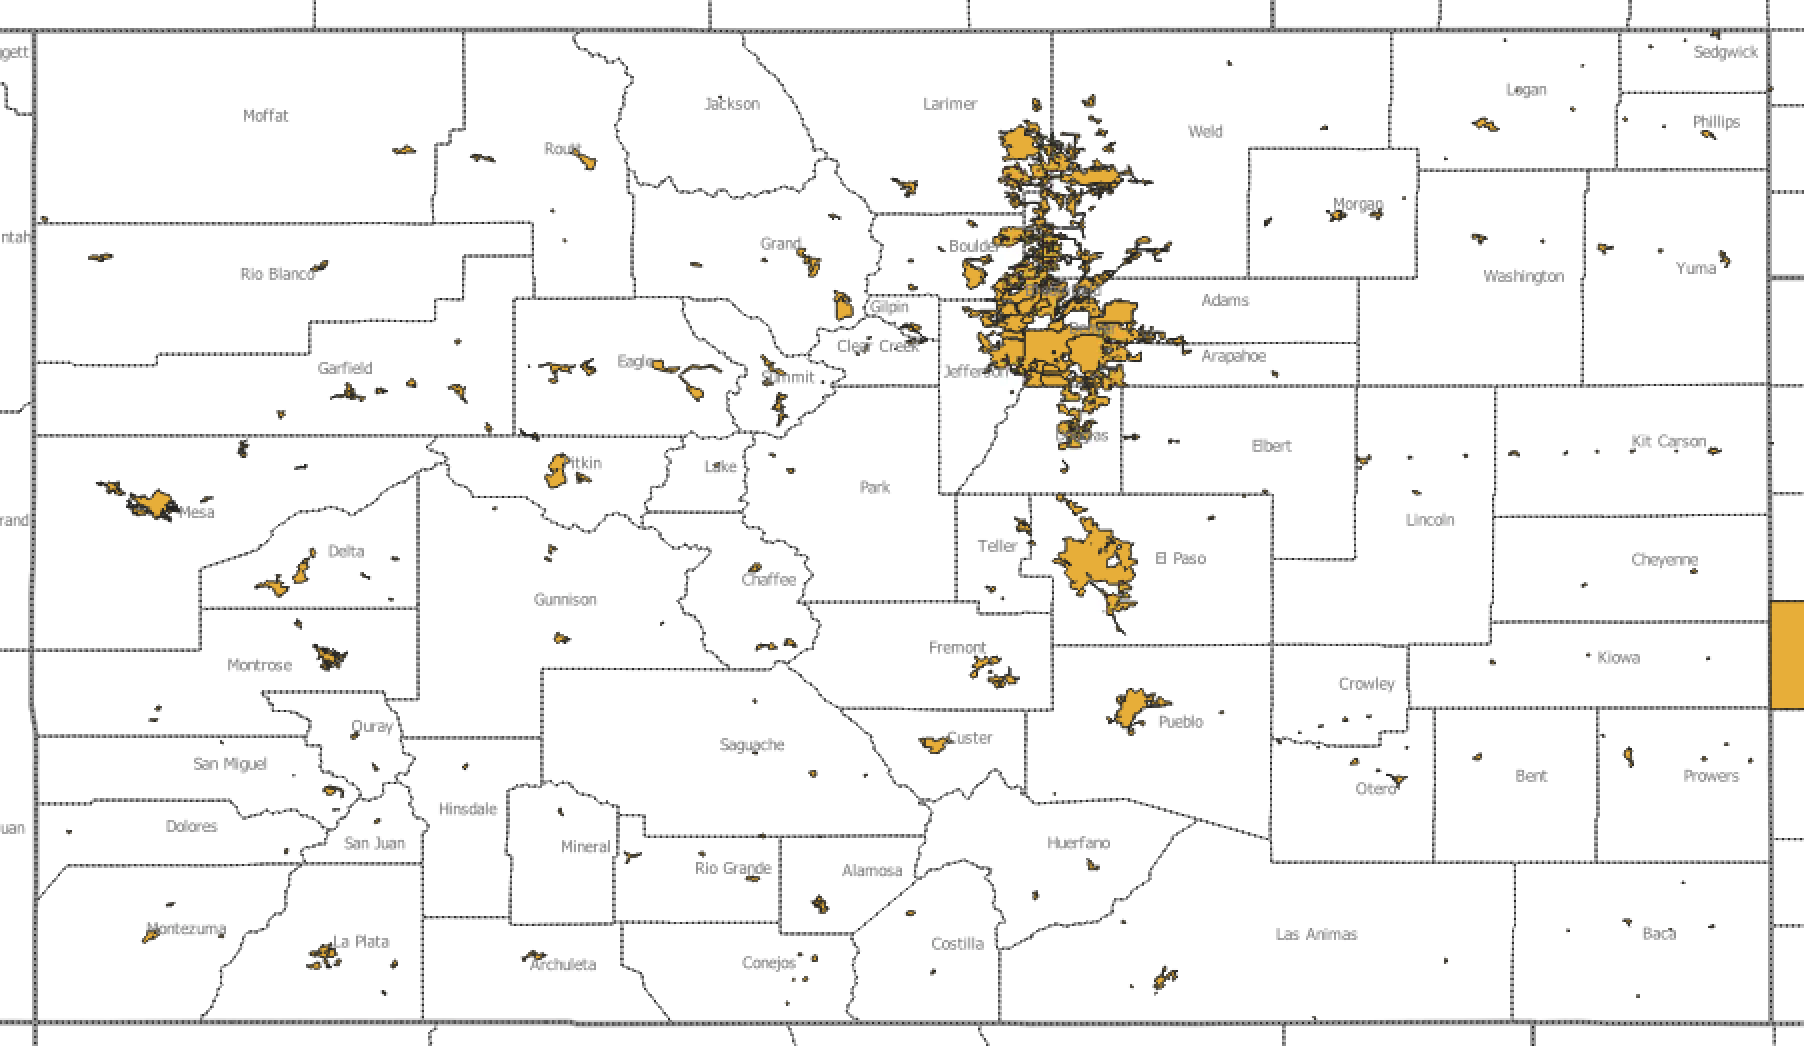
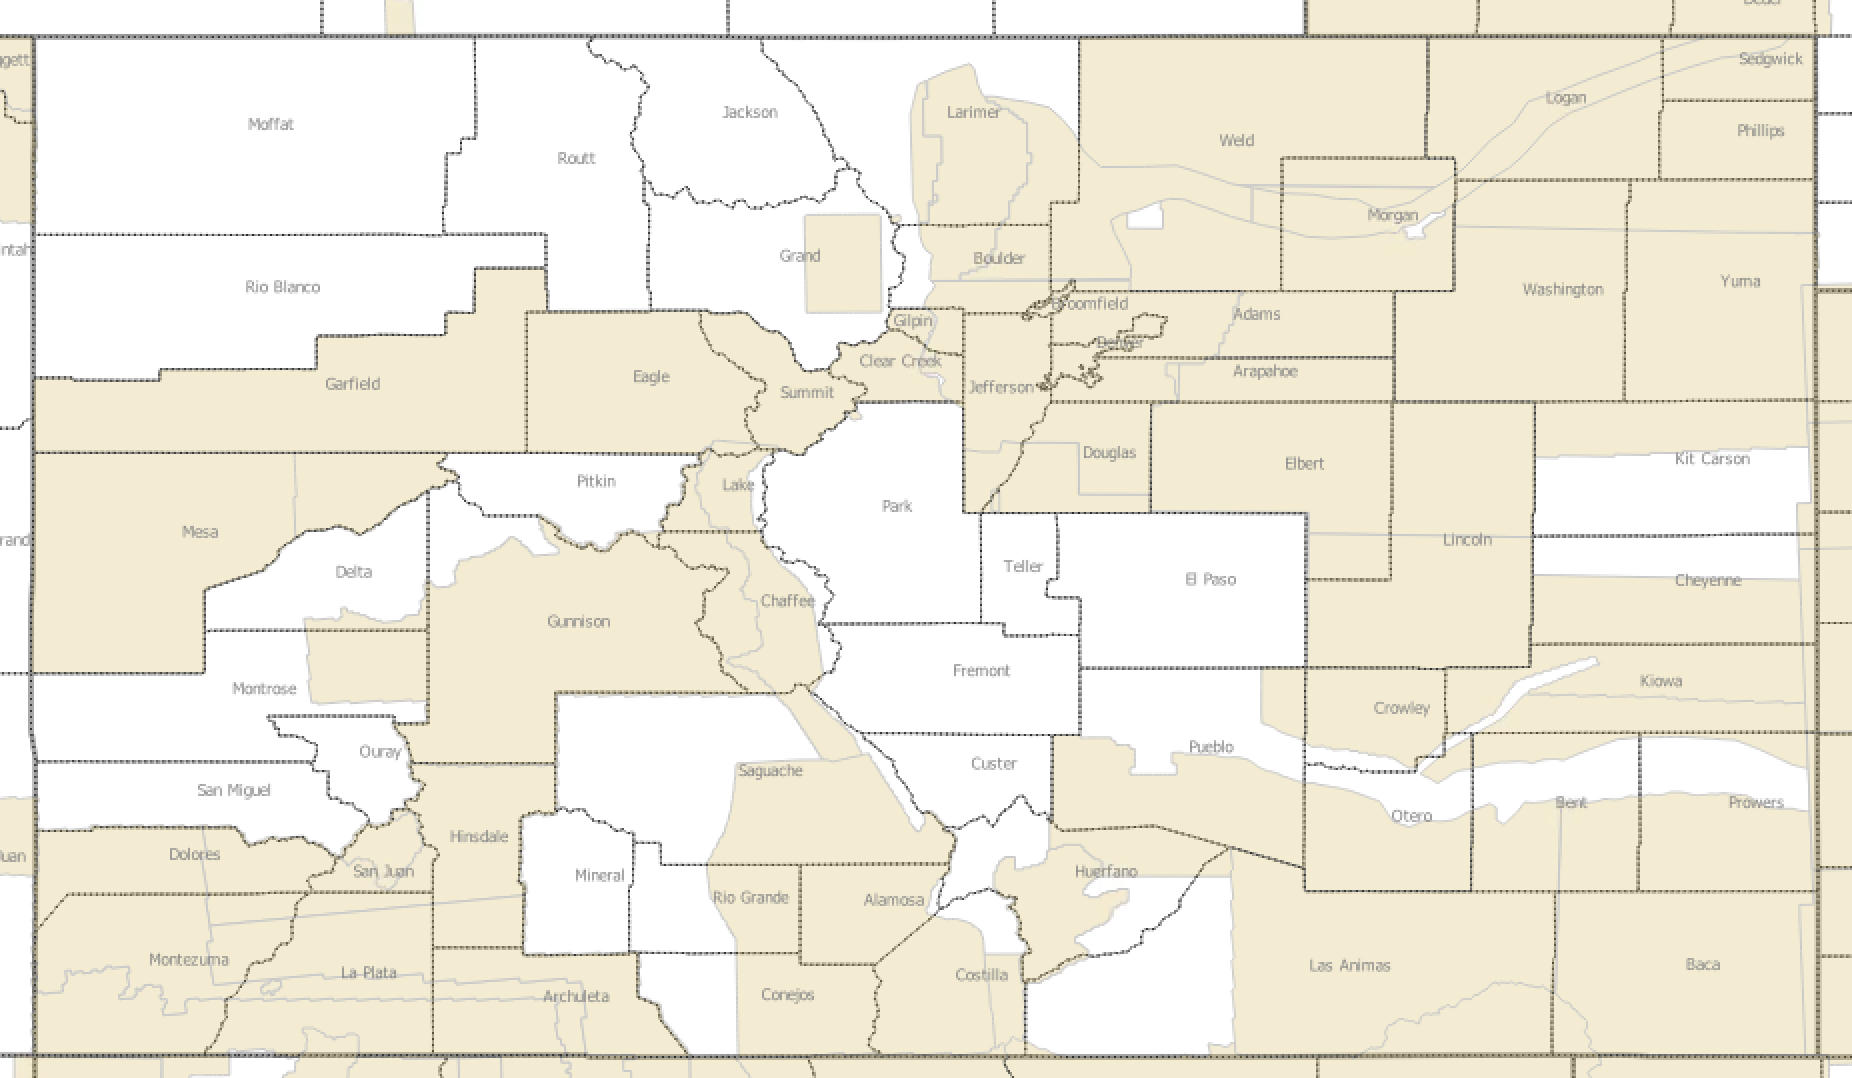
LIDAR Index (Coverage)
The LiDAR index data layer shows where Pivvot can support 3-meter digital elevation model generation to calculate high resolution slope. The yellow areas show the areas where LIDAR data exists. This information is integral to the solar siting application.
Why is LiDAR important?
LiDAR can be used to as a source to calculate slope for solar and wind siting as well as transmission or pipeline routing.
Bringing it all Together
The power of the Pivvot platform is that we can easily pull in spatial data and overlay on top of each other to reveal patterns heretofore unseen. The map above shows wind events, LIDAR Coverage, Stream Gauges and Wind Turbines all in one, which you could see could impact the sites available and suitable for a renewable project.
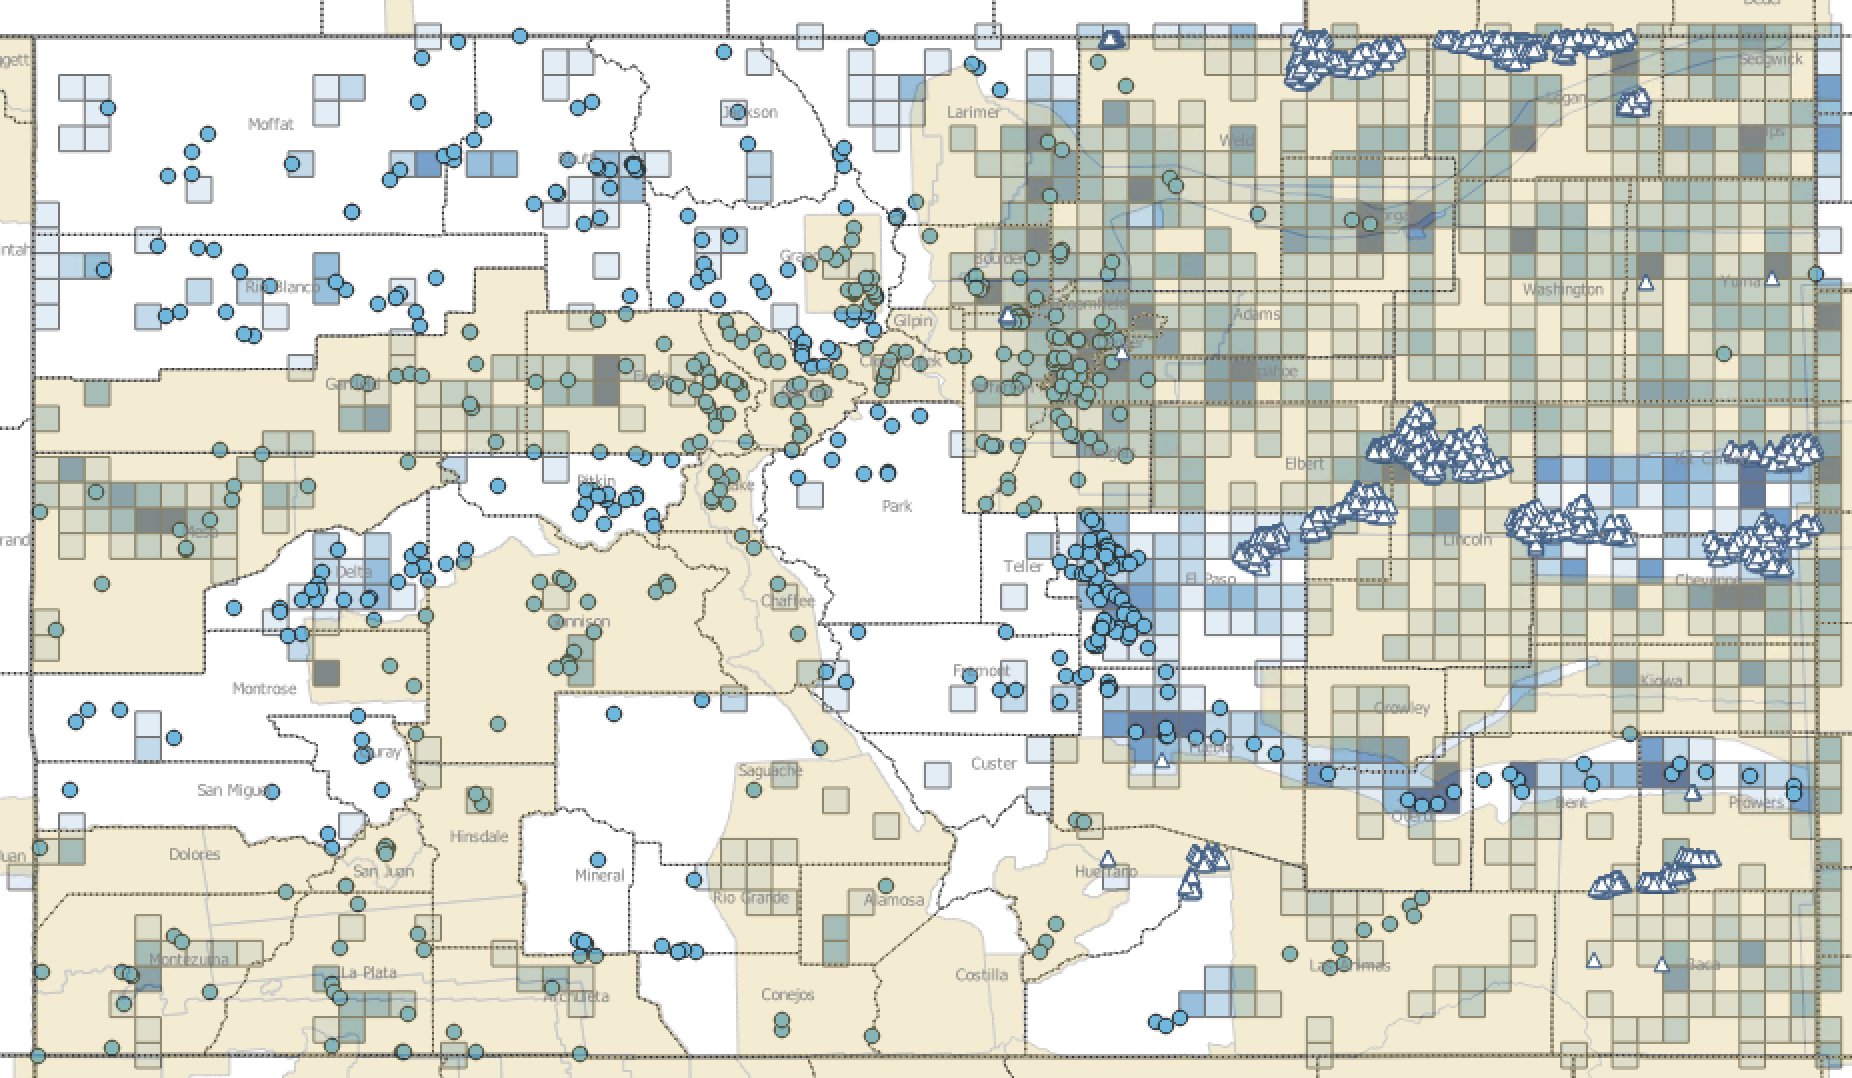
Want to see Pivvot's data in action? Setup your free trial today!